
As the U.S. continues to navigate the lasting ripple effects of the COVID-19 pandemic, key economic indicators are sending mixed messages about where the economy stands today.
On the positive side, GDP increased by 6.9% in the last three months of 2021, and consumer spending started off strong in 2022. Simultaneously, year-over-year inflation is at record levels according to the Consumer Price Index, and the U.S. Federal Reserve is raising interest rates to slow the economy.
Many supply chain issues from 2021 have extended into 2022, with new COVID-19 outbreaks in China, the Russian invasion of Ukraine and high energy prices creating additional challenges.
The labor market provides another set of unclear signals. The Bureau of Labor Statistics reported in April 2022 that the unemployment rate had fallen to 3.6%, around where it was in February 2020 before the pandemic hit the U.S. The “Great Resignation” amid the pandemic has record numbers of workers leaving jobs to seek out positions that pay more or provide better working conditions.
But workers have more power in the economy in large part because the labor force participation rate remains below pre-pandemic levels, which means fewer people are available for all the jobs that are currently open.
To determine the states with the most job openings, researchers at Commodity.com calculated the average job openings rate for the fourth quarter of 2021, the most recent quarter available. The data used in this analysis is from the U.S. Bureau of Labor Statistics Job Openings and Labor Turnover Survey (JOLTS). In the event of a tie, the state with the greater total number of job openings was ranked higher. Researchers also included statistics on hiring rates, total hires, and total employment.
Here are the states with the most job openings.
15. West Virginia

Average job openings rate: 7.47%
Average hire rate: 5.13%
Average monthly job openings: 56,000
Average monthly hires: 35,667
Average monthly employment: 694,805
14. Indiana

Average job openings rate: 7.47%
Average hire rate: 4.77%
Average monthly job openings: 251,333
Average monthly hires: 148,000
Average monthly employment: 3,104,895
13. Maryland

Average job openings rate: 7.50%
Average hire rate: 3.80%
Average monthly job openings: 217,667
Average monthly hires: 102,333
Average monthly employment: 2,692,982
12. Massachusetts

Average job openings rate: 7.50%
Average hire rate: 3.70%
Average monthly job openings: 288,667
Average monthly hires: 132,333
Average monthly employment: 3,576,577
11. North Carolina

Average job openings rate: 7.57%
Average hire rate: 5.07%
Average monthly job openings: 375,667
Average monthly hires: 232,333
Average monthly employment: 4,585,526
10. Missouri
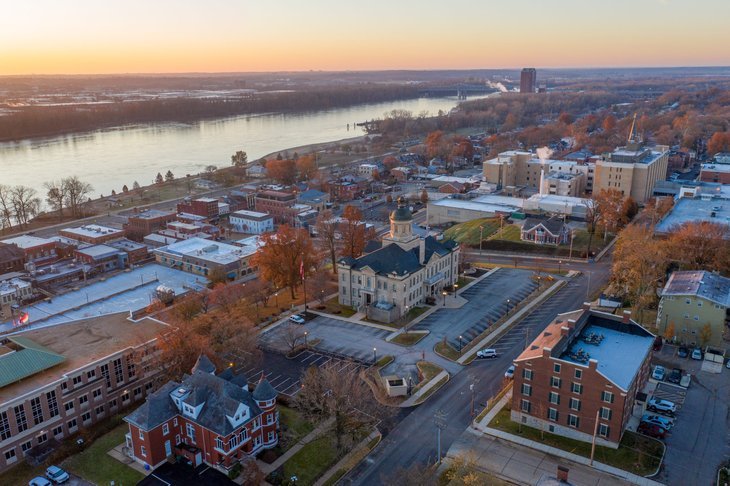
Average job openings rate: 7.60%
Average hire rate: 4.03%
Average monthly job openings: 235,333
Average monthly hires: 115,000
Average monthly employment: 2,851,240
9. Vermont

Average job openings rate: 7.77%
Average hire rate: 4.70%
Average monthly job openings: 25,000
Average monthly hires: 14,000
Average monthly employment: 297,872
8. South Carolina
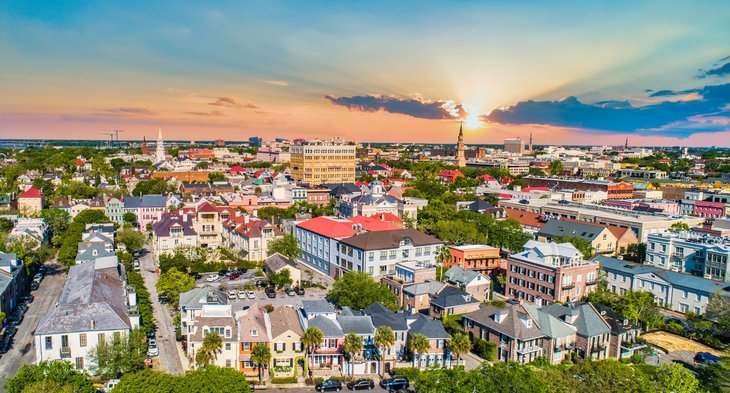
Average job openings rate: 7.87%
Average hire rate: 5.57%
Average monthly job openings: 184,667
Average monthly hires: 120,333
Average monthly employment: 2,161,677
7. Michigan
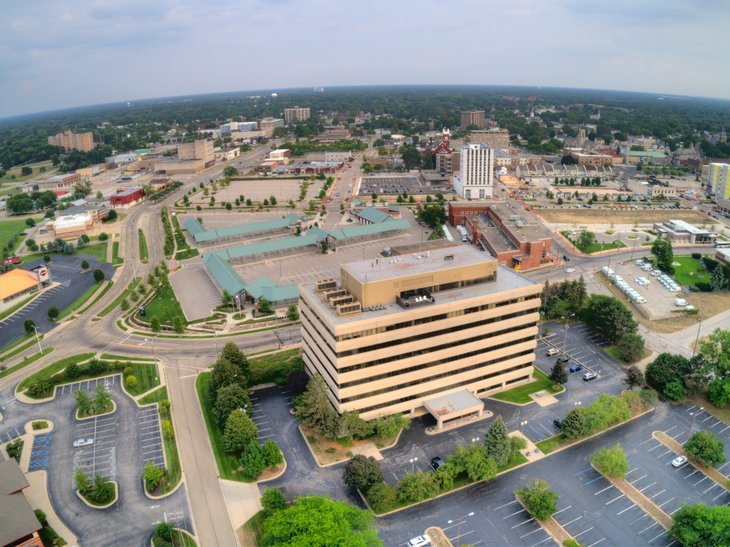
Average job openings rate: 7.90%
Average hire rate: 4.80%
Average monthly job openings: 365,333
Average monthly hires: 204,000
Average monthly employment: 4,250,000
6. Wyoming
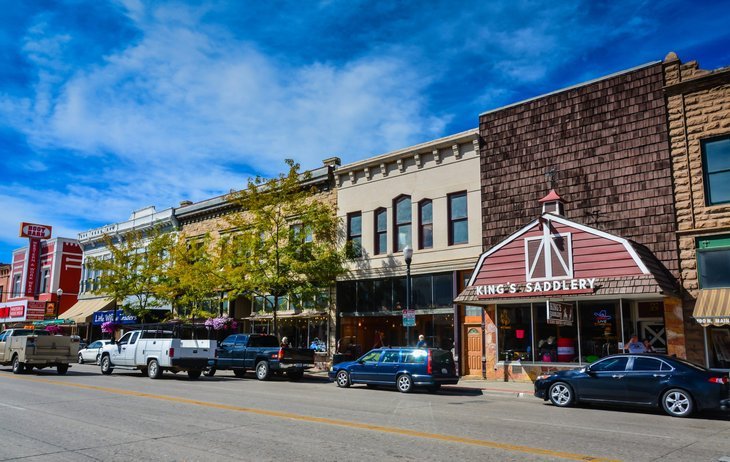
Average job openings rate: 7.93%
Average hire rate: 5.17%
Average monthly job openings: 24,000
Average monthly hires: 14,333
Average monthly employment: 277,419
5. New Hampshire

Average job openings rate: 7.93%
Average hire rate: 4.80%
Average monthly job openings: 57,667
Average monthly hires: 32,000
Average monthly employment: 666,667
4. Georgia
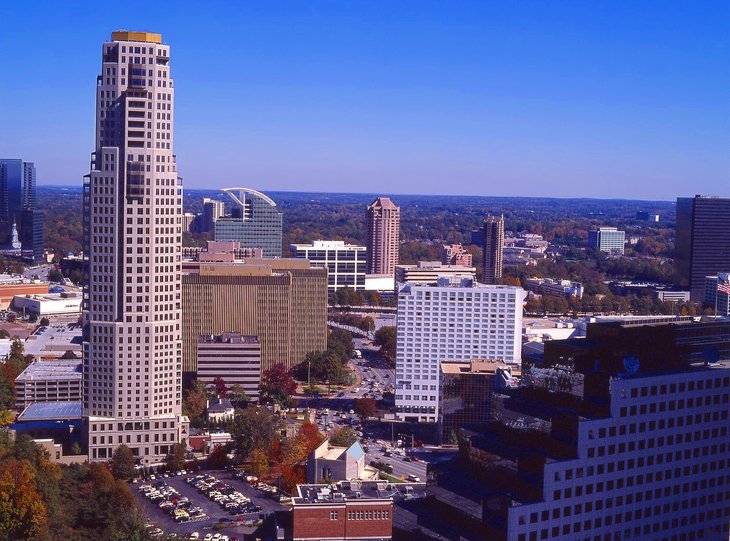
Average job openings rate: 8.23%
Average hire rate: 5.30%
Average monthly job openings: 416,667
Average monthly hires: 245,333
Average monthly employment: 4,628,931
3. Montana
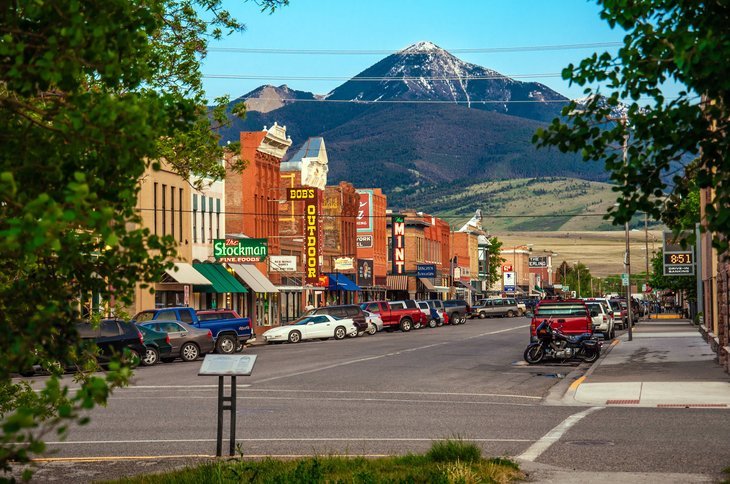
Average job openings rate: 8.37%
Average hire rate: 5.40%
Average monthly job openings: 44,667
Average monthly hires: 26,333
Average monthly employment: 487,654
2. Hawaii
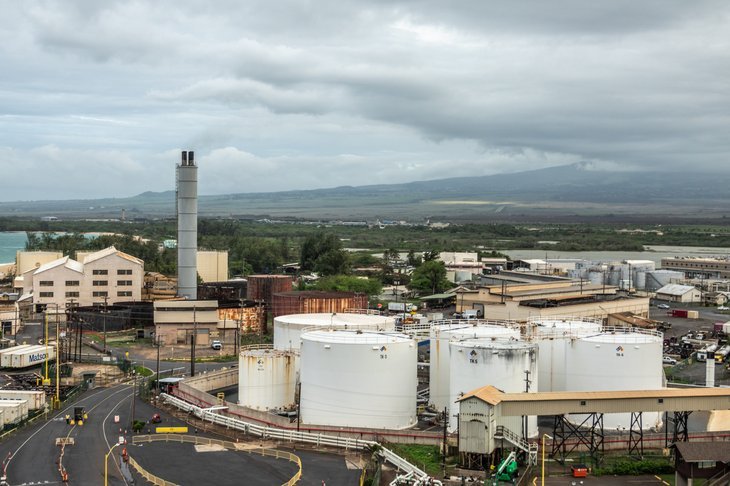
Average job openings rate: 8.60%
Average hire rate: 5.73%
Average monthly job openings: 55,000
Average monthly hires: 33,333
Average monthly employment: 581,395
1. Alaska
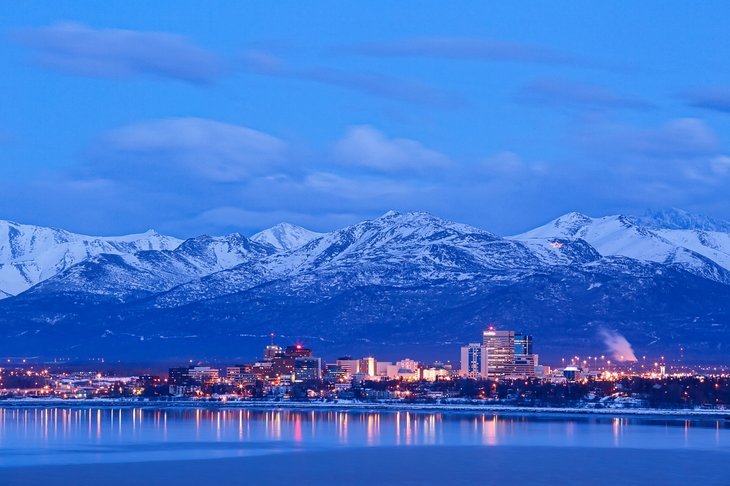
Average job openings rate: 9.00%
Average hire rate: 6.17%
Average monthly job openings: 31,000
Average monthly hires: 19,333
Average monthly employment: 313,514
Methodology

The data used in this analysis is from the U.S. Bureau of Labor Statistics Job Openings and Labor Turnover Survey (JOLTS).
To determine the states with the most job openings, researchers calculated the average job openings rate for the fourth quarter of 2021, the most recent quarter available.
In the event of a tie, the state with the greater total number of job openings was ranked higher. Researchers also included statistics on hiring rates, total hires, and total employment.
Disclosure: The information you read here is always objective. However, we sometimes receive compensation when you click links within our stories.


