If you’ve been working in digital marketing for a while, you’re no doubt aware of what all the various metrics and acronyms mean for your process. You know your impression versus your engagement data, your CTR from your CTA, you understand MER, ROAS, etc.
But if you’re just starting out, that last sentence probably hurt your head, and likely prompted you to run a few quick Google searches to get up to speed, and/or check if I just made them up (I didn’t).
It’s easy to forget that what’s general knowledge for most is not universal, and as such, it’s important to clarify what each stat and metric actually represents, even platform-by-platform in some cases, to ensure that you and your team are all on the same page.
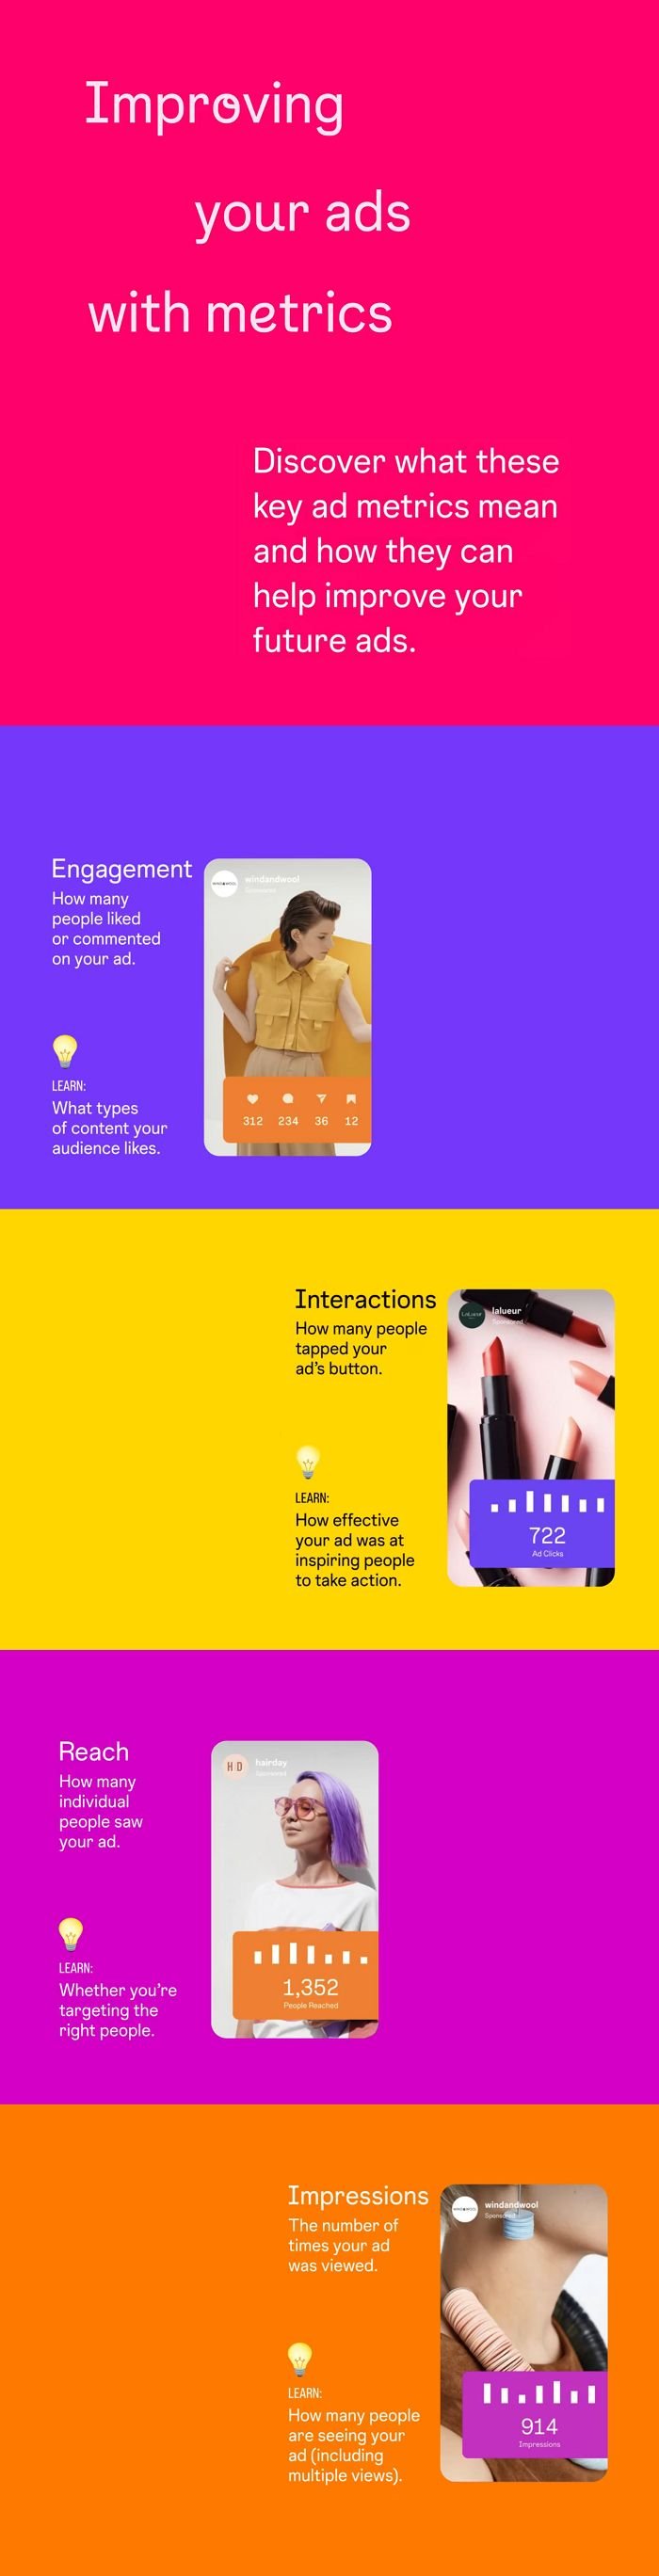
This could help. This week, Instagram has published a new overview of key ad metrics, and what each actually means in practical terms, which could help in your planning.
We’ve brought the full overview together into the below infographic.