These stats will either make you very happy with your own performance, or maybe relieved that your numbers are comparable to others in the space.
Rival IQ has published its latest social media benchmarks report, which looks at the average performance that brands are seeing across the major social platforms.
Based on 150 companies, the data looks at the performance of brands with over 25k Facebook followers, and 5k Twitter and IG fans. This time around, Rival IQ has also included TikTok benchmark data, which provides some helpful comparison insight for your planning.
You can download the full report here, which includes industry breakdowns as well, but in this post, we’ll take a look at the key stats.
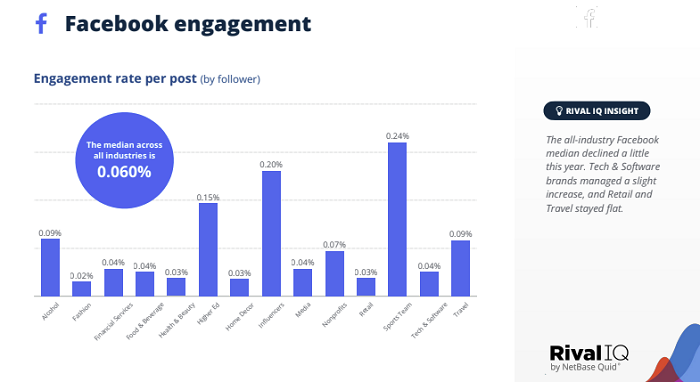
First off, on Facebook – the average Facebook engagement rate is 0.060%, down slightly from last year’s report.

So, on average, brands aren’t even generating a response from 1% of their audience with each post.
It’s worth noting that this is engagement, not reach, so this doesn’t mean that people aren’t seeing your content. But in most cases, people simply don’t feel compelled to interact.
For comparison, in 2019 and 2020, Facebook engagement according to the same Rival IQ report, was 0.09% and 0.08%, so it’s been a steady decline for brand engagement, which continues to slide even further.
Which is not great for your Facebook planning, but it does provide some perspective on what you should expect.
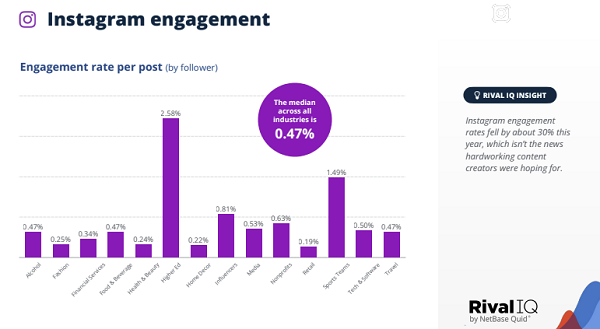
Instagram engagement is better, at 0.47%.

Though that’s also in decline – last year, according to the same report, Instagram engagement was at 0.67%, while it was at 0.98% in 2021.
Increased competition, shifting user behaviors – there are various reasons for this, but again, this gives you some idea of what other brands, in general, are seeing in the app.
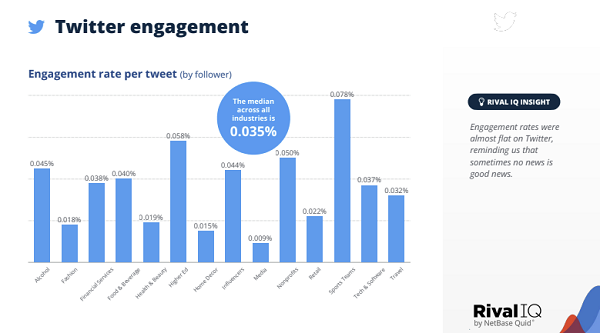
Twitter engagement, meanwhile, is at 0.35%, slightly down from last report.

Twitter engagement was at 0.045% in 2020, and amid the various changes at the app, it’s hard to know exactly what’s coming next.
Maybe, if you pay for Twitter’s coming Verification for Organizations, that will give you even more reach. But who knows – I’m not sure even Twitter fully understand how these elements will impact this as yet.
But this is probably the one you want to see:

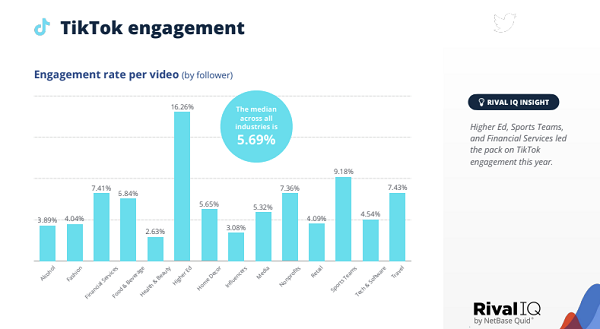
TikTok engagement per brand video is a whopping 5.69%.
Now, that likely relates to the brands that are stepping into TikTok taking the time to understand the platform, which leads to better engagement. But it also signals significant opportunity, which will likely be of interest to many looking to optimize their social media approach.
It’s worth noting, too, that brands are posting a lot less to TikTok (1.75x per week) than they are to other platforms, which would also influence these results. But the comparative performance is significant – if you can get it right, TikTok can generate big reach.
These are some interesting notes on brand engagement, and what you can expect to see on all of the major apps. Really, it comes down to your understanding of your audience, and how you drive action based on that, but it is also likely comforting to note that all brands are seeing relatively low engagement.
Does that mean that people want to engage with brand content less, or that brands, in general, are not great at connecting with them? You decide.
You can read Rival IQ’s full report, including industry and posting frequency breakdowns, here.


